Using Android's Hidden Sampling Profiler
Profiling on Android is usually limited to the tracing profiler. In this blog post I will describe how to use the hidden sampling profiler instead, which offers many advantages.
Profiling on Android
When developing performance-sensitive apps on a mobile device profiling is one of the most important techniques to figure out what code takes the most time. The standard way to do this on Android is to use the built-in tracing profiler. But using the tracing profiler has some serious shortcomings. Most importantly turning on tracing means measuring a totally different application, because tracing adds a serious overhead. The overhead is caused by method instrumentation making method calls much more expensive. This issue is compounded by the fact that tracing on Android turns off the JIT. Another problem is that the number of recorded events is limited by the trace size. With the default trace size (8 MB) only a few seconds of execution time can be recorded.
The ‘hidden’ sampling profiler
Those issues could be overcome by using a sampling profiler which records the stack trace of the running threads at a chosen sampling rate. Unfortunately sampling profiling is not officially supported on Android. There has been some development lately in the AOSP Git repositories which suggest that this is about to change, but nothing definite has been announced yet. Even if it becomes available it will most likely only be supported on future Android versions.
Luckily there is a hidden sampling profiler in Android going back at least as far as Android 2.3. There are some obstacles to using it though. It is not supported by the Android development tools and it is an in-process profiler which cannot be triggered from the Dalvik Debug Monitor Server (DDMS). Furthermore it is not included in the ADT android.jar files thus preventing easy integration. Also the API is not stable and has in fact changed considerably from Android version to Android version.
Introducing: The Android Sampling Profiler Facade
To make it easy to use the sampling profiler we have created an small library, the Android Sampling
Profiler Facade. It is packaged as a JAR file.
To use just drop it into the libs/ directory of your Android project.
If your project is an Android Studio project you also have to add the JAR dependency
to your build.gradle file:
1 2 3 | |
Since the Android sampling profiler is in-process you need to add some code to your app. The public API of
the facade is in the com.appfour.samplingprofiler.SamplingProfilerfacade class.
First initialize the profiler, e.g. in on the onCreate() method of an activity using the init() method.
The init() methods takes parameters which can not be changed for this profiling session:
stackDepth– specifies number of stackframes that are being captured during profiling. With a higher number more of the callchain to hotspots will be visible when analyzing the captured data later. But a higher stack depth also requires more memory on the VM heap during profiling. A stack depth of ten is a good number to start with.intervalInMs– specifies the interval between samples taken in milliseconds. The lower the number the higher the resolution. But a lower number also means that the sampling profiler requires more memory and affects the behavior of the program more. An interval of 10 ms (equivalent to about 100 samples per second) is a good value to start with.The third parameter specifies what threads are being sampled. There are several overloads for specifying all threads, a fixed number of threads, or a dynamically computed ThreadSet.
Sampling can be started and stopped using the startSampling() and stopSampling() methods. This way
only the interesting parts of the app are being profiled.
Once all interesting parts have been profiled the profiler can be shut down and profiling data can be
written out with the writeHprofDataAndShutdown() method.
The following example shows how to launch the profiler when the activity is started and how to stop taking samples and write the profiling data once the activity is stopped.
1 2 3 4 5 6 7 8 9 10 11 12 13 14 15 16 17 18 19 20 21 22 23 | |
Analyzing the profiling data
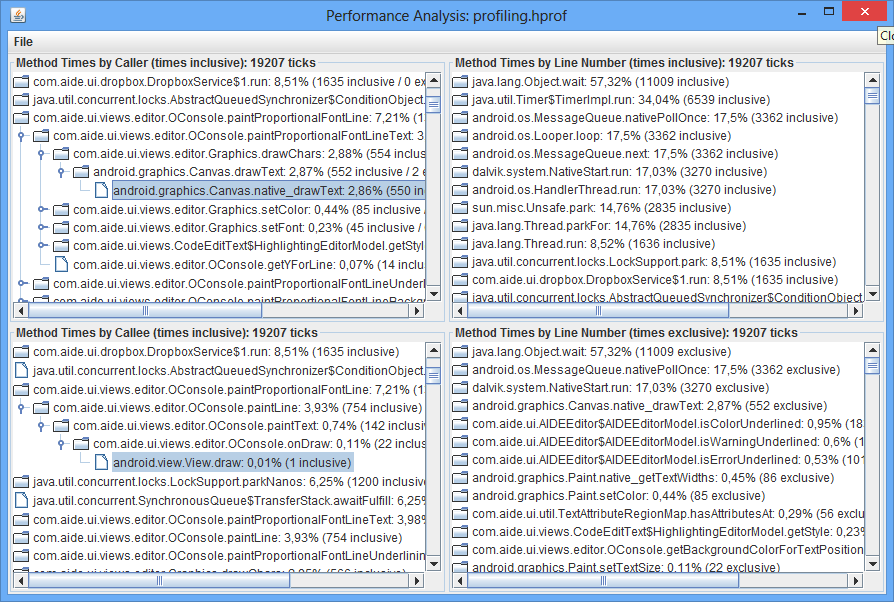
The profiling data is written out in HPROF format. The only tool I have found which can analyze
those files is JPerfAnal. It looks a bit outdated and
does not have a lot of features but it works well enough for finding hotspots.
After copying the .hprof file onto your PC run JPerfAnal with java -jar jperfanal.jar sampling.hprof.
The line number information captured does not seem to be accurate so the ‘Method times by Caller’ and ‘Method times by Callee’ sections are the most interesting.

Links
Give it a spin and let us know if it works for you!